
your knowledge, accessible
Why Knowledge Graphs?
Escaping the Silo
Knowledge Graphs for AECO — a course for domain experts
Where we are going today
- Explain what a graph is — nodes and edges — and why it feels more natural for building data than a spreadsheet.
- Name at least three silos in your own organization, and where they disagree with each other.
- Tell the difference between an app-centric and a data-centric way of organizing information.
- Recognize that a knowledge graph is not "yet another application" but an integration layer on top of what you already have.
The information we already have
The problem:
Information is trapped in silos, it's incomplete (or in multiple incompatible versions) and therefore hardly accessible
The Facility Manager's Monday morning
A tenant reports a broken radiator.
Before lunch, the FM has to:
- Open the CMMS to log a ticket
- Open the BIM viewer to find which zone the radiator is in
- Check a spreadsheet to see who last serviced it
- E-mail the mechanical contractor, because none of these systems know about each other
The same physical radiator, four separate times
Four identities. Four silos. And the only thing connecting them is you.
Same problem, different job
The four-system radiator, every Monday morning.
A rezoning question needs the GIS parcel data, the local plan PDF, and a spreadsheet of prior approvals nobody has updated in a year.
"Which of our buildings have overdue lift certifications?" means opening a different CMMS export for every building manager.
Designing, maintaining and operating a built asset involves expertise from a myriad of professions
Therefore, there are many perspectives on each and every subset of the project
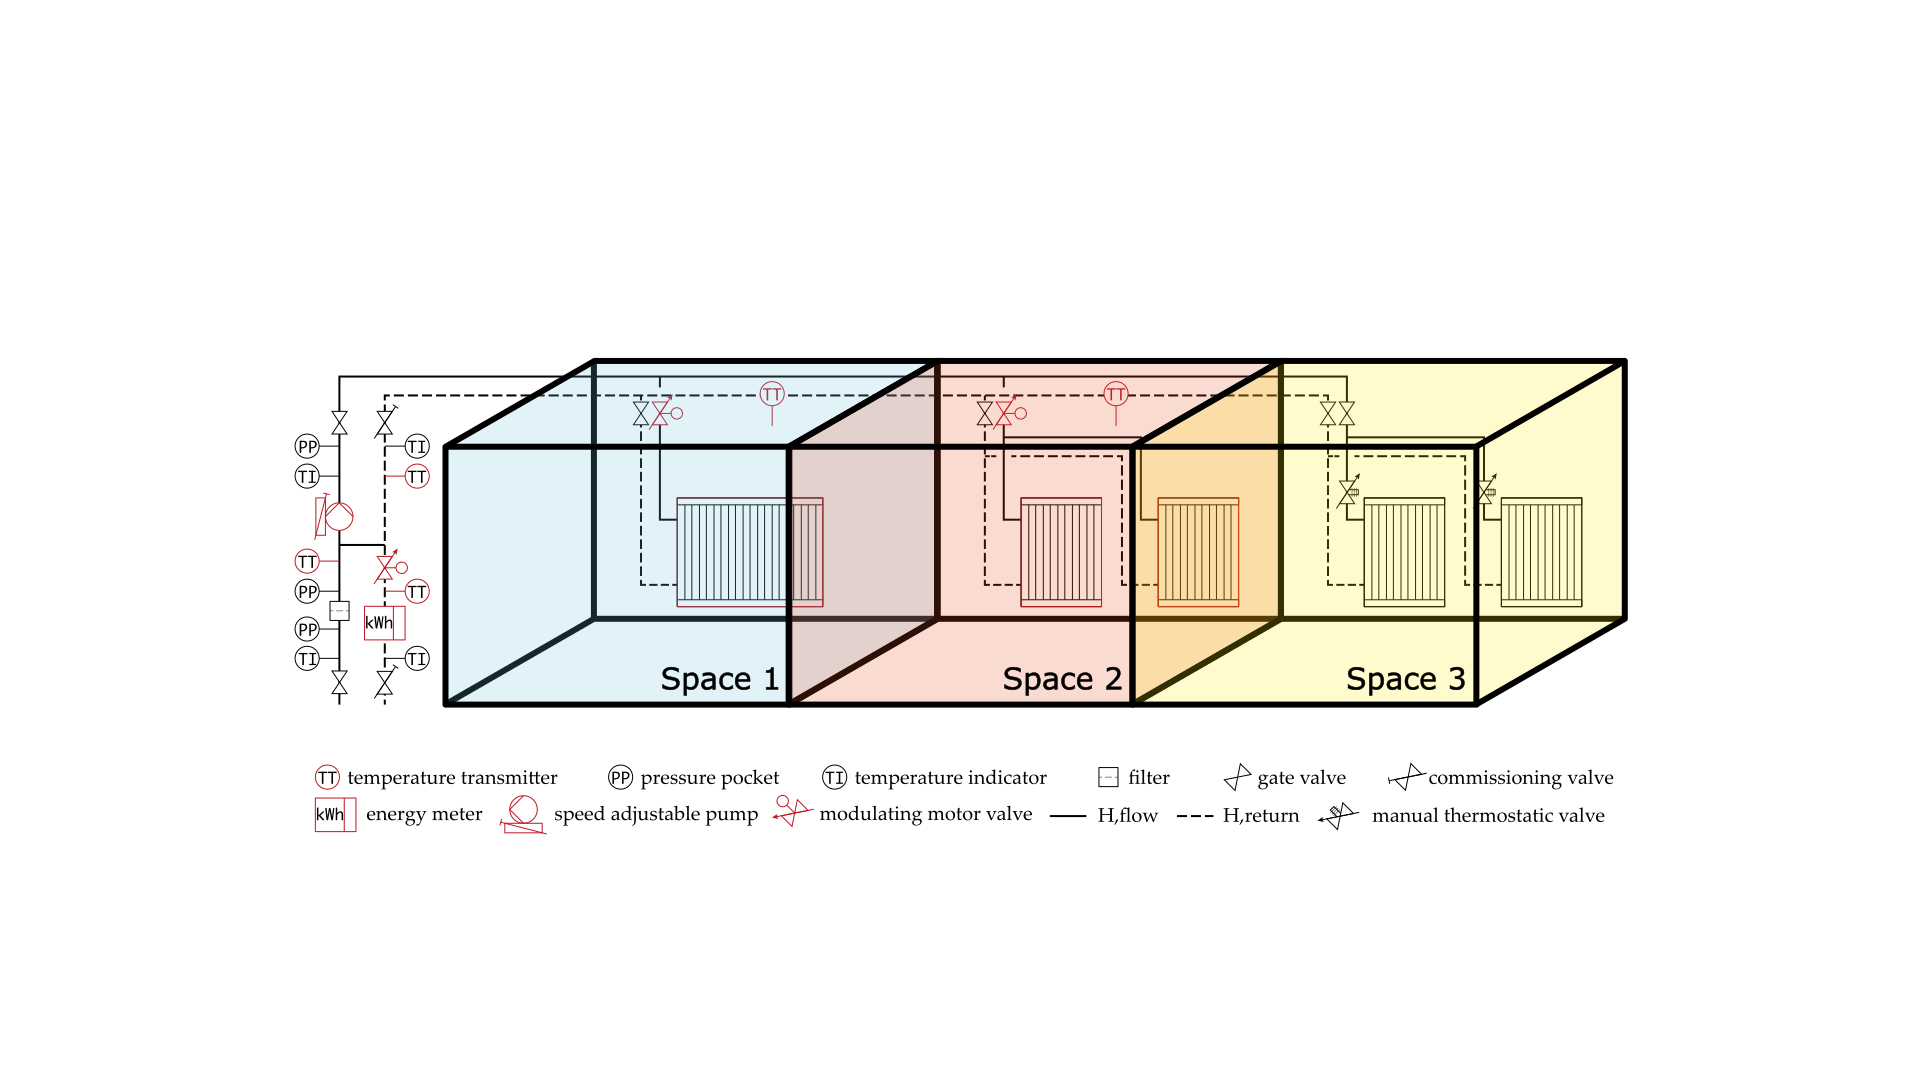
What do you see?
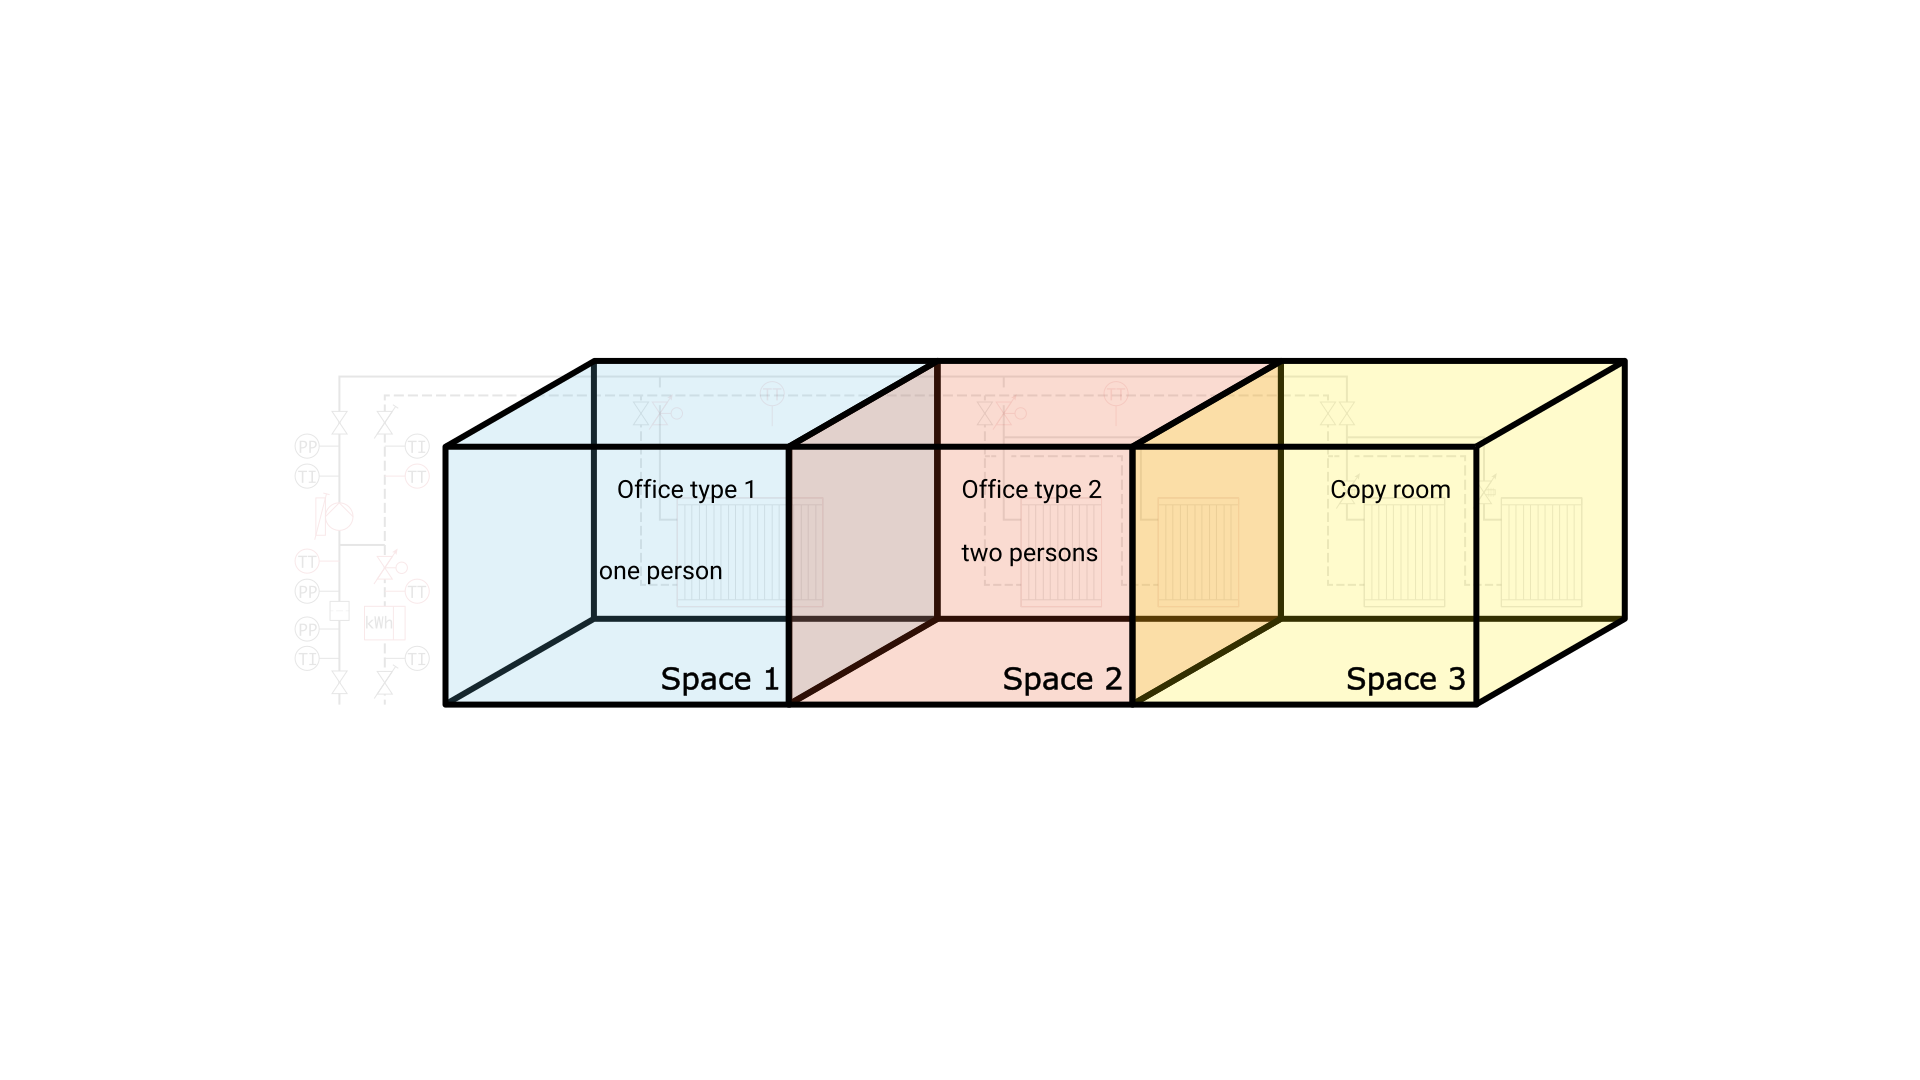
What the architect sees
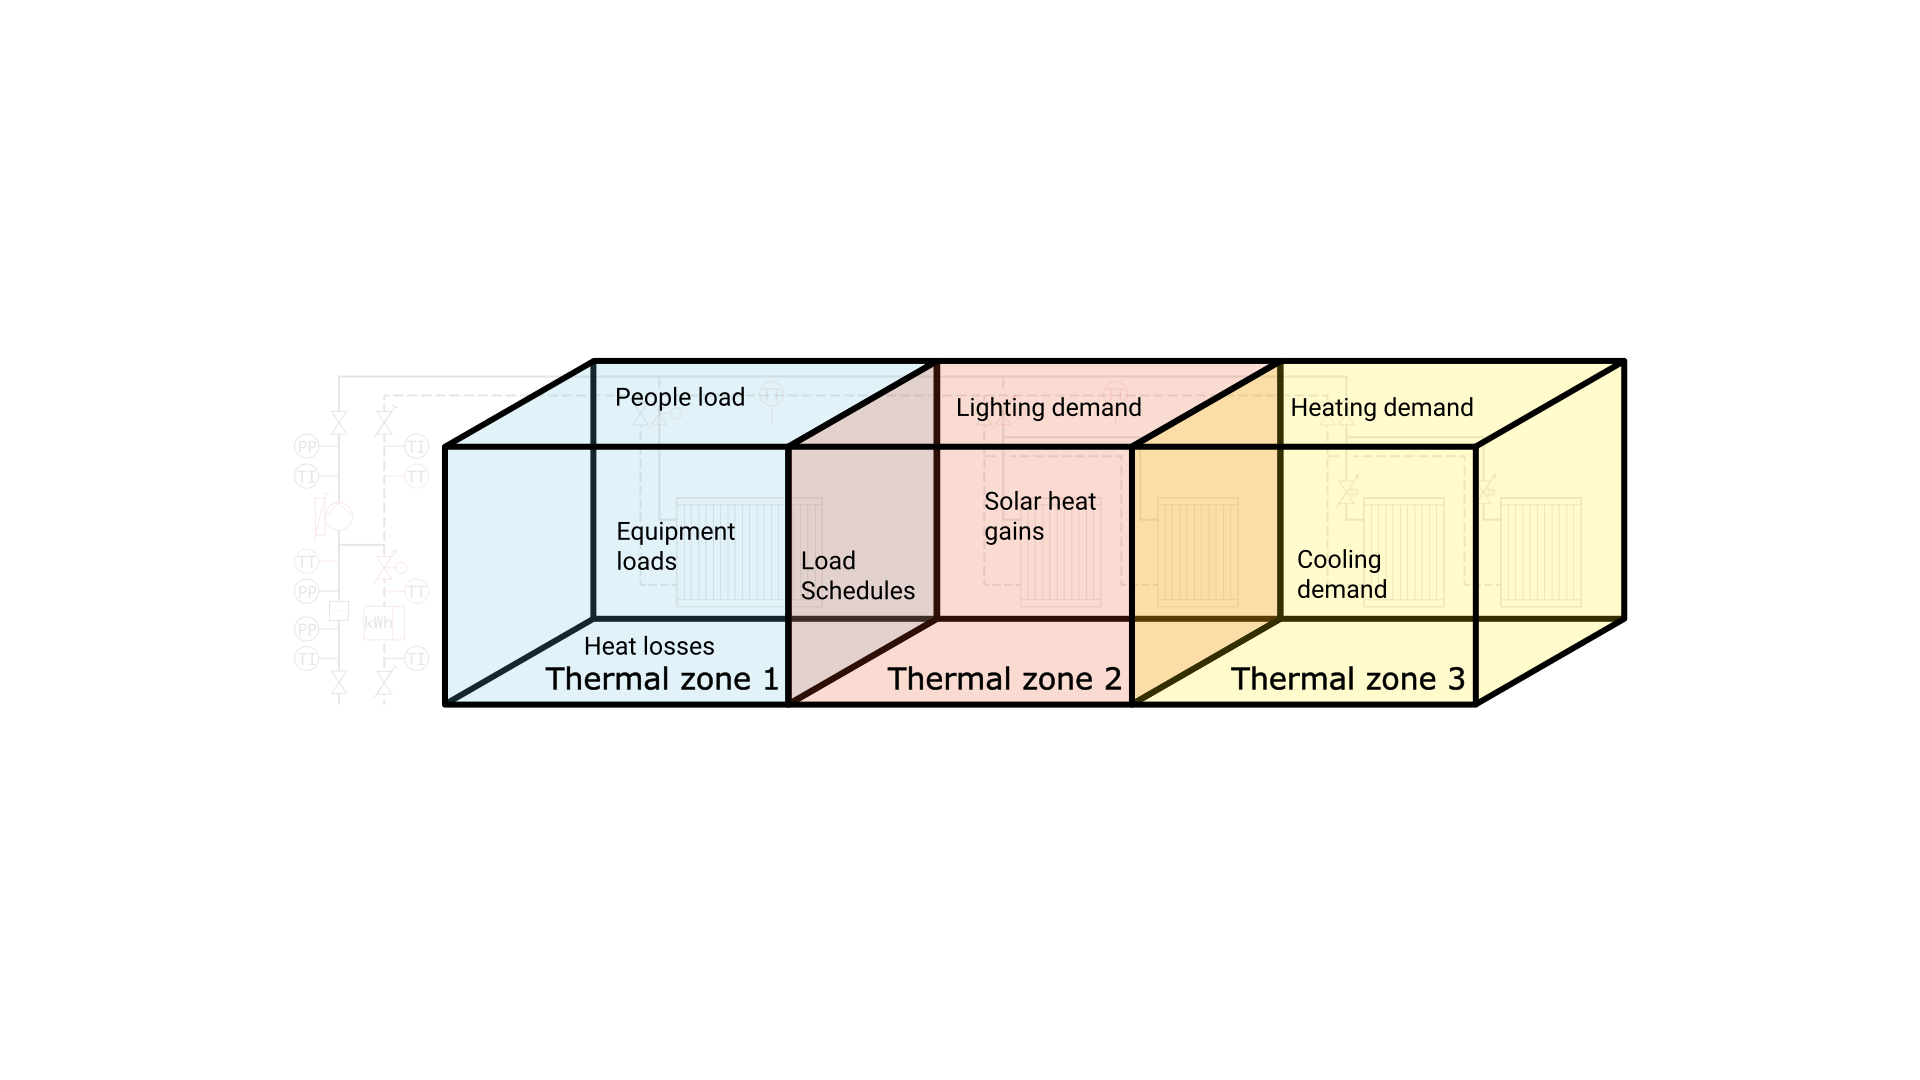
What the ICE engineer sees
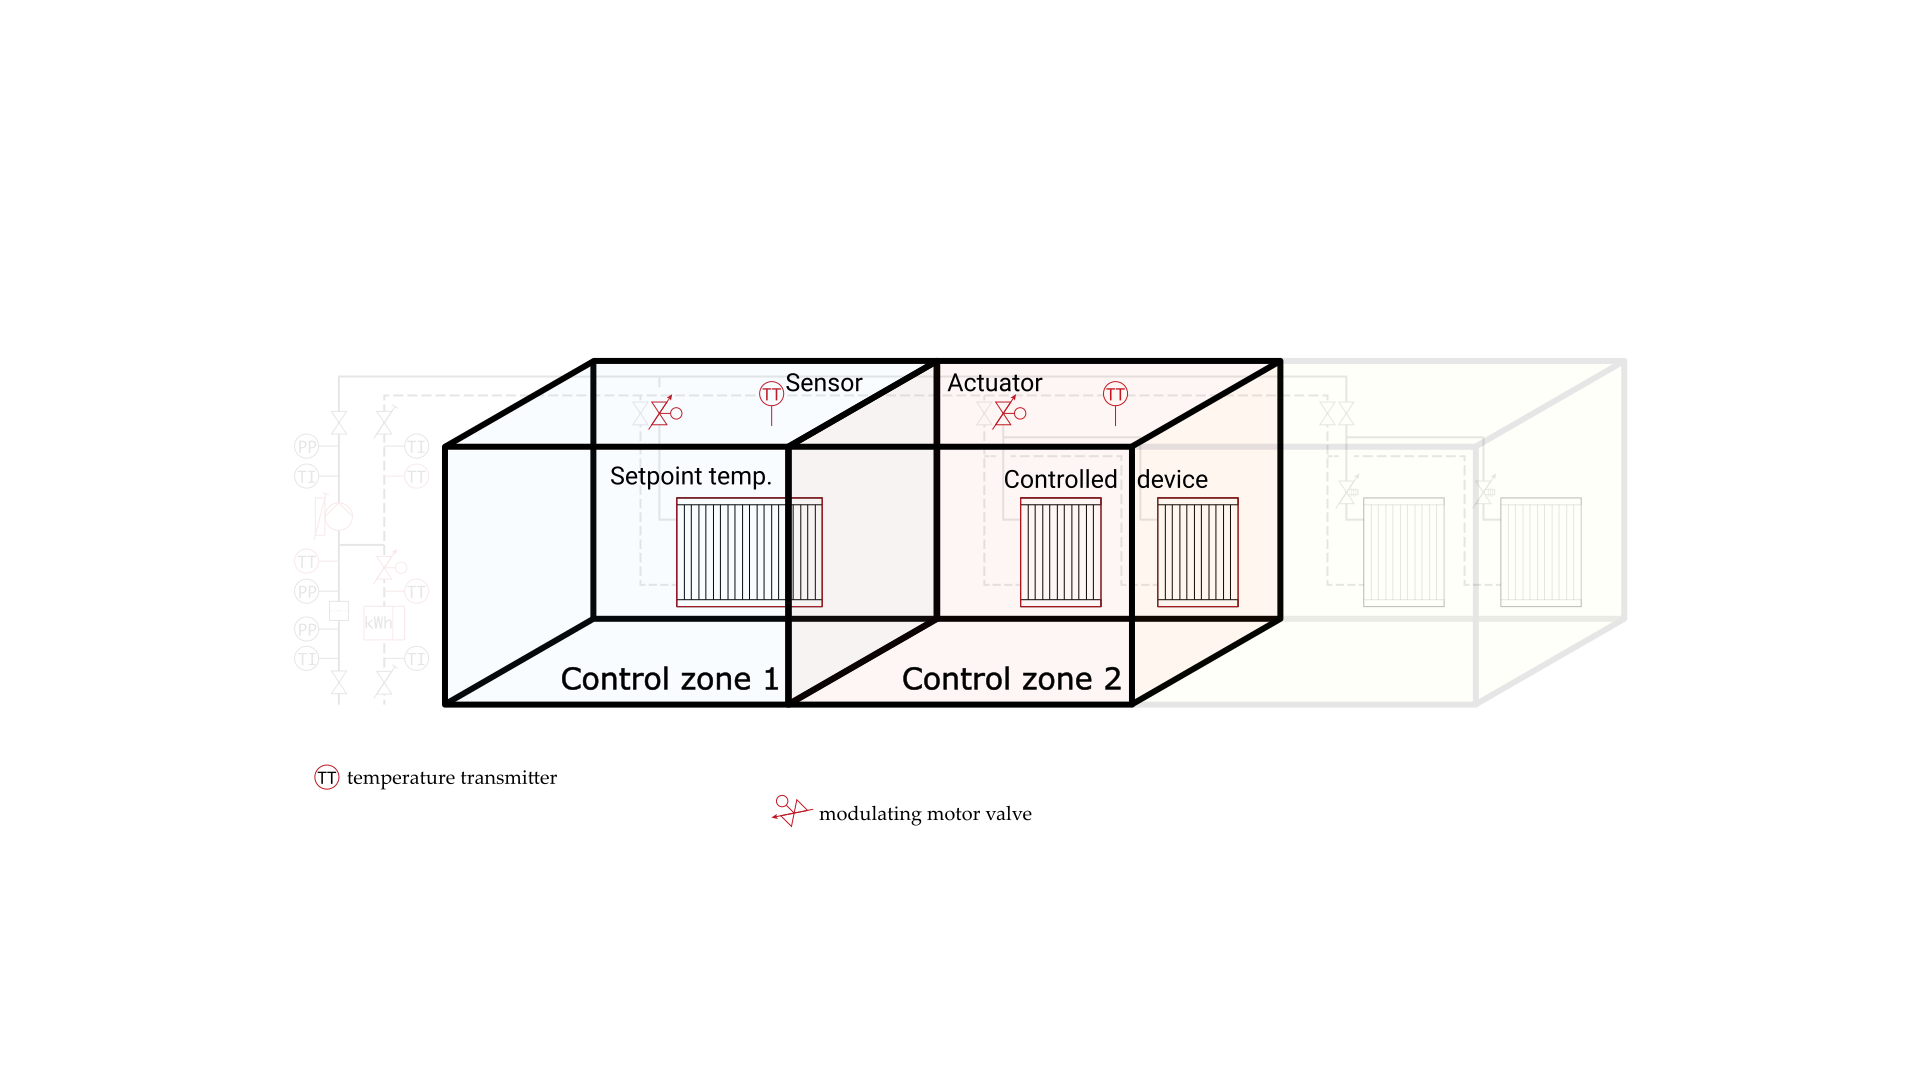
What the low voltage engineer sees
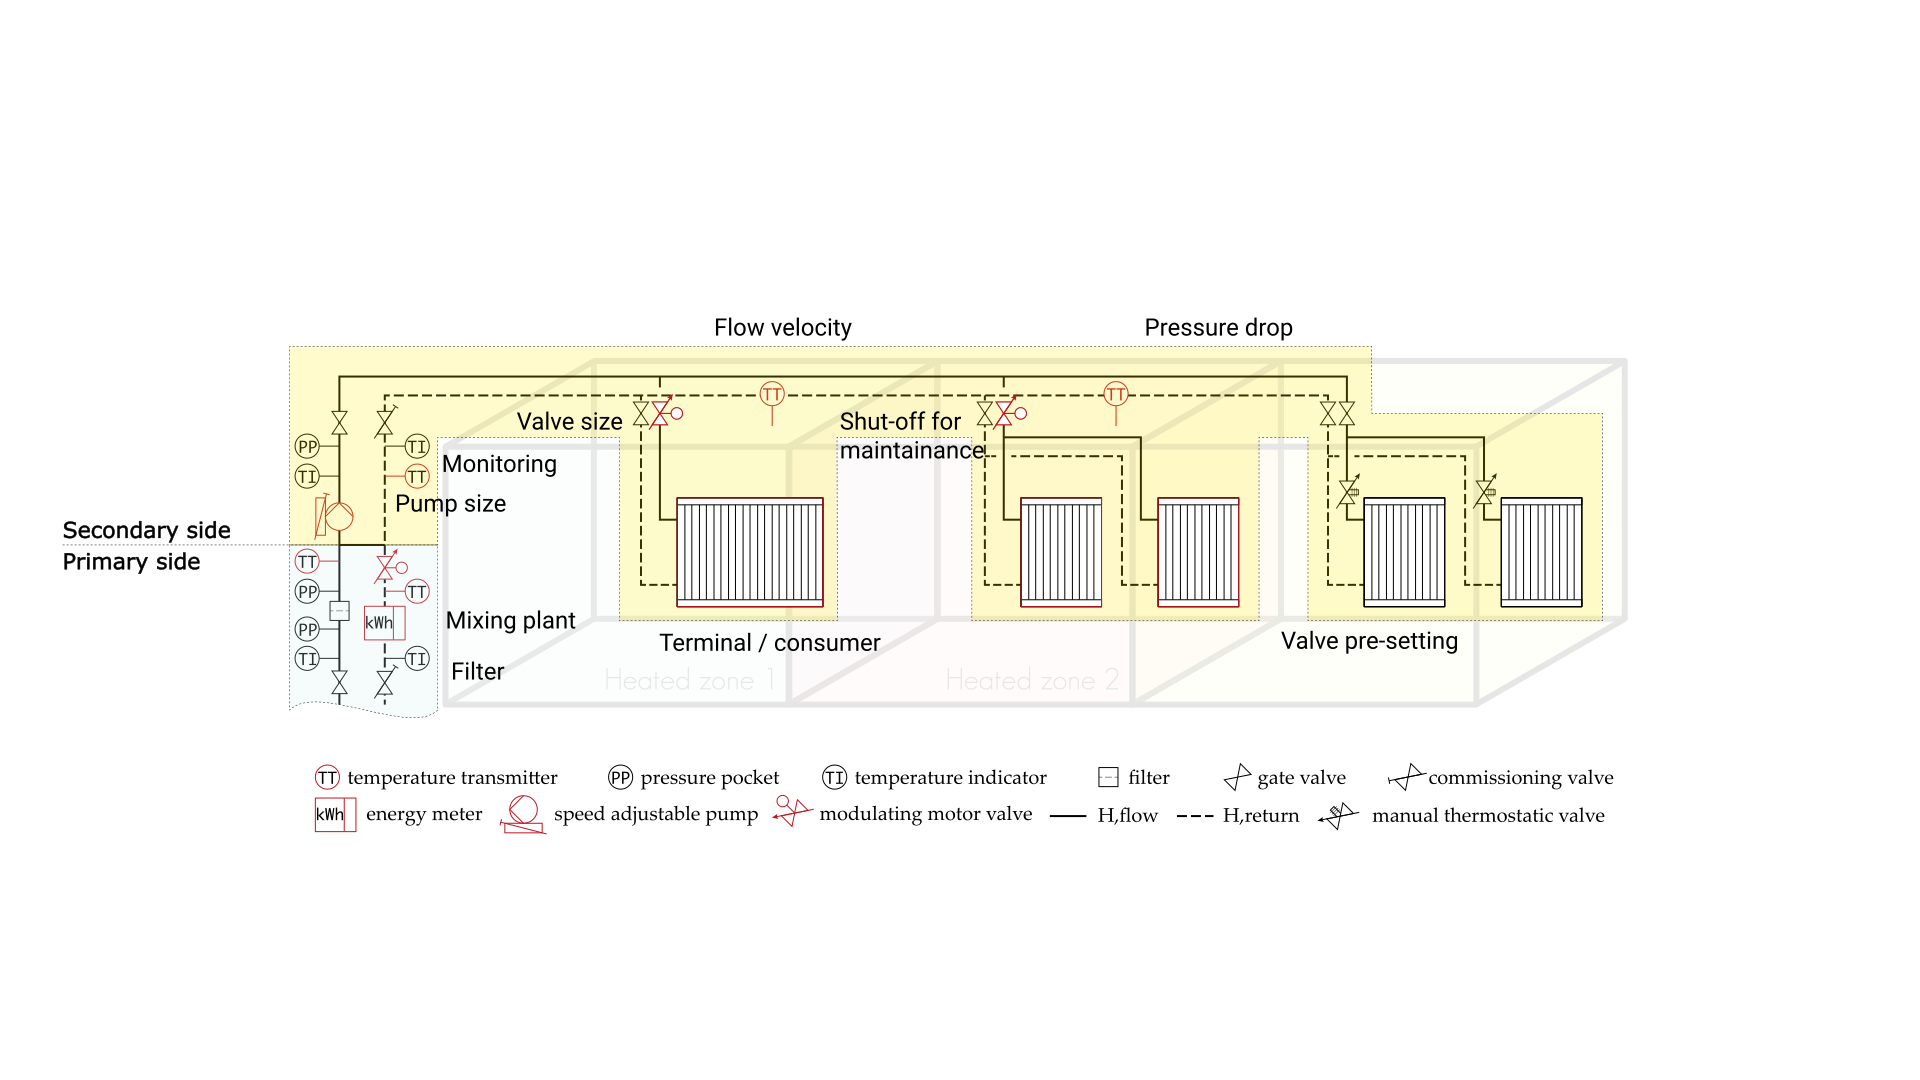
What the HVAC engineer sees
The reality
No project has ONE BIM model
Not all information is
(or should ever be) in the
BIM model
- Reports
- Meeting minutes
- e-mails
- Calculations
- Images from site registrations
- Point cloud scans
- Reference images
- Sketches
- Norms & Regulations
Information is scattered across different files and often on different document management systems (DMSs)
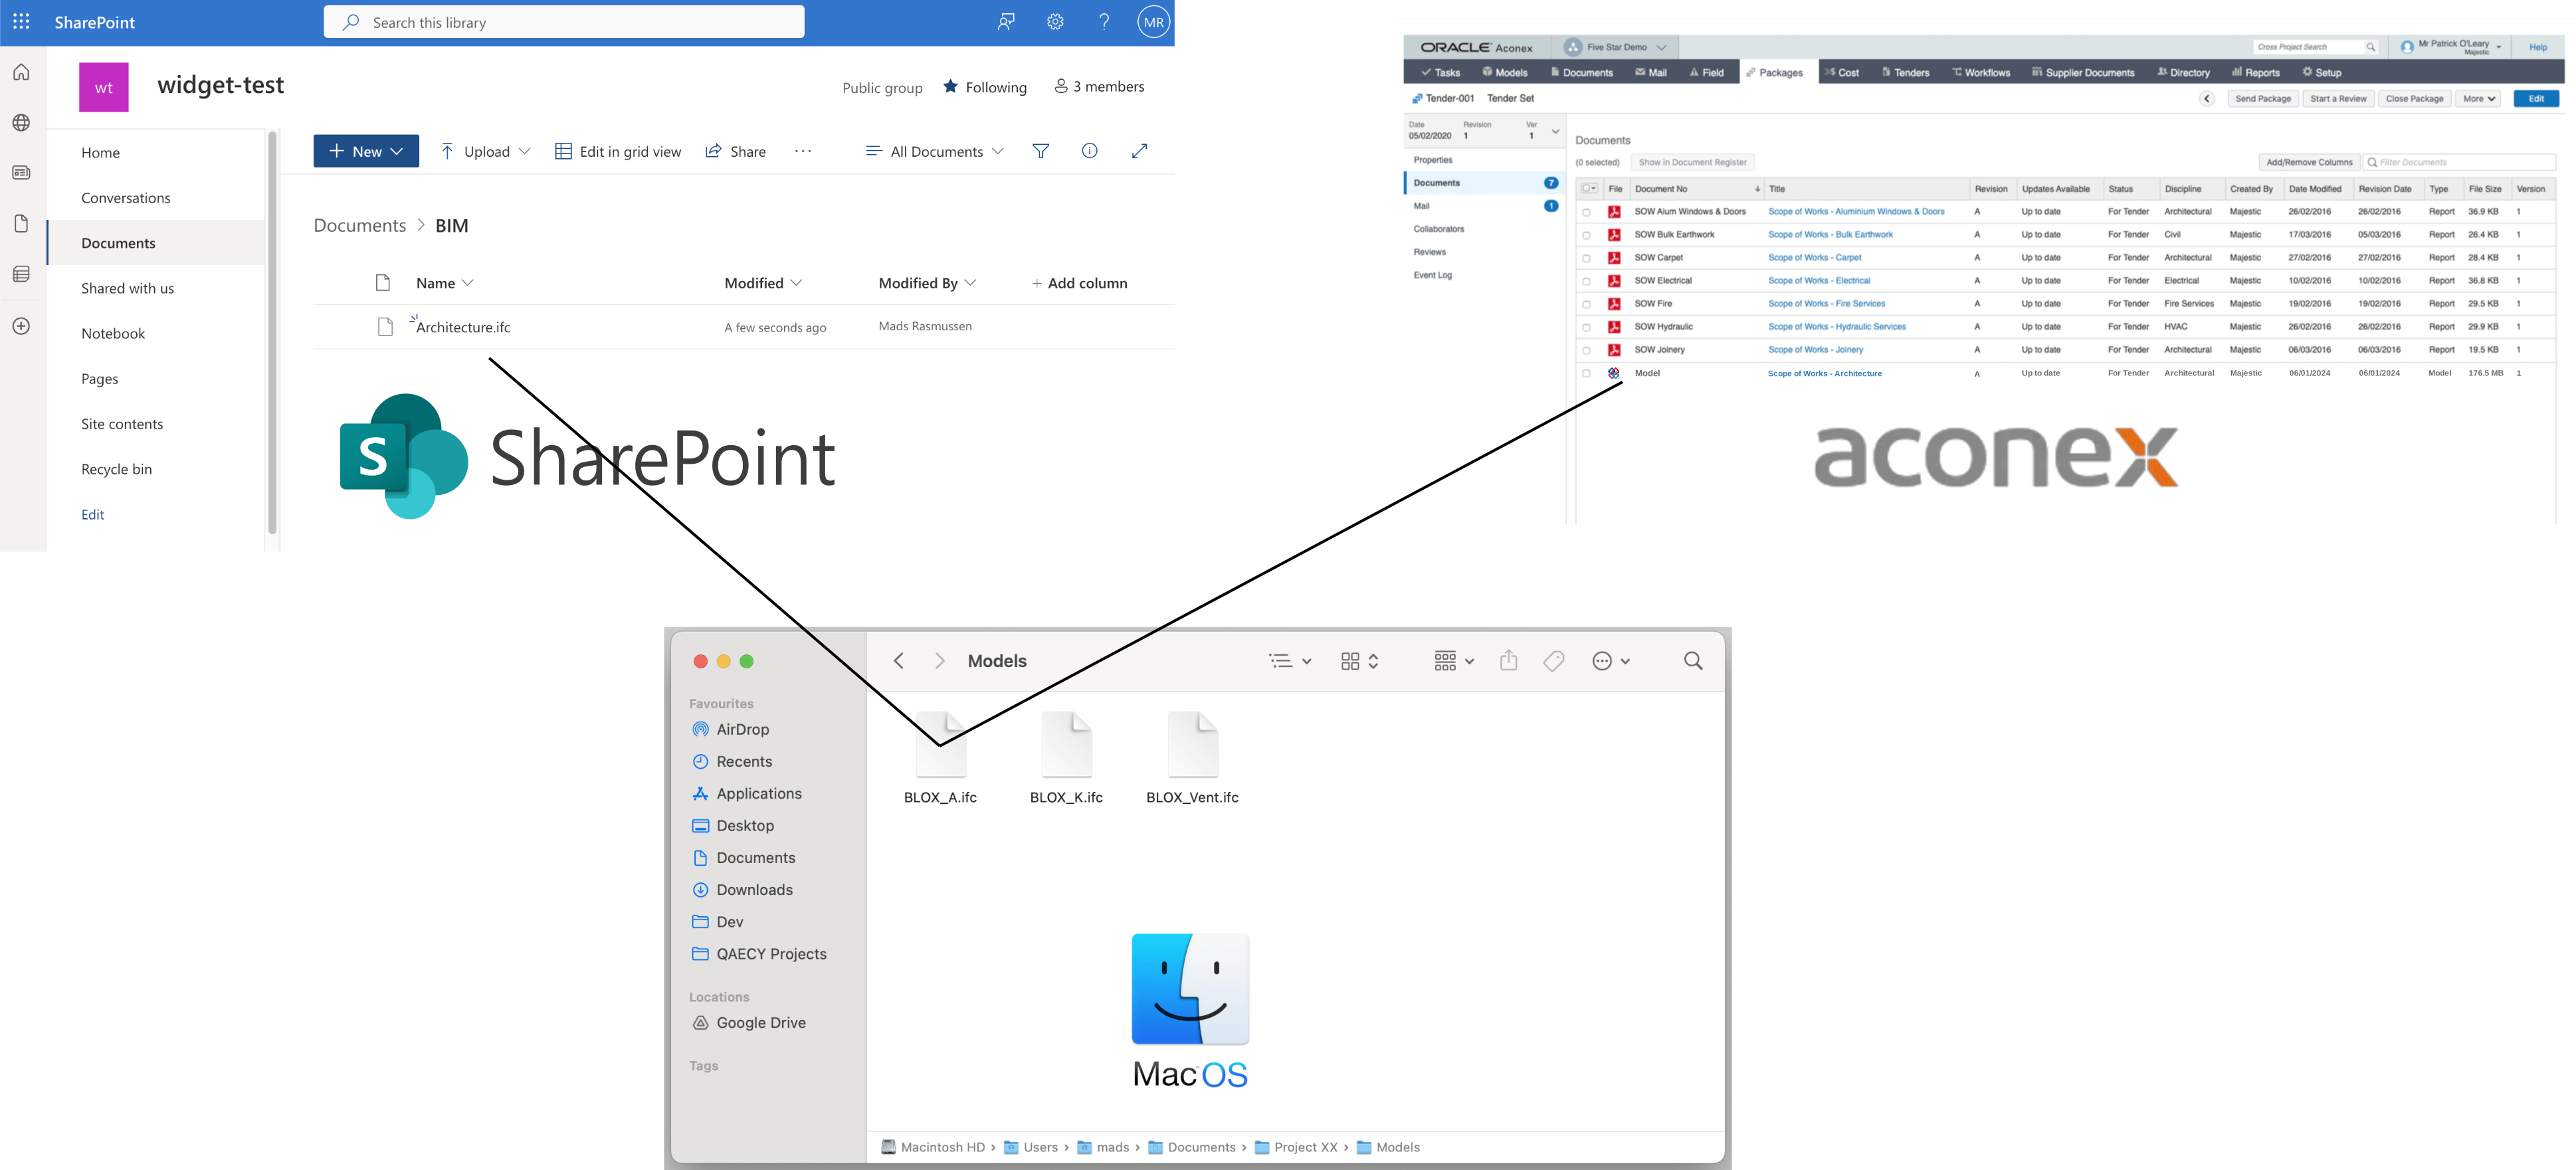
"Is this the most recent version of that plan drawing?"
"What documents describe this pump?"
One shelf per book
Library of
Trinity College Dublin
We need structure. Let's order the web by category!
All we need is a search bar!
The construction industry is still in the Yahoo age
Why does this keep happening?
Every time we have a problem, we buy or build an application for it
…and every application quietly becomes a silo, with its own copy of the truth and its own idea of what a "space", a "contract" or an "asset" even is.
Dave McComb — The Data-Centric Revolution
App-centric
A human copies between them
Retire the app → the data goes with it
Data-centric
Retire an app → the data stays
Stop asking
"which application should own this data?"
Start asking
"what does this data mean, and how
does it connect to everything else we know?"
So what is a graph?
A graph is a network of nodes and edges
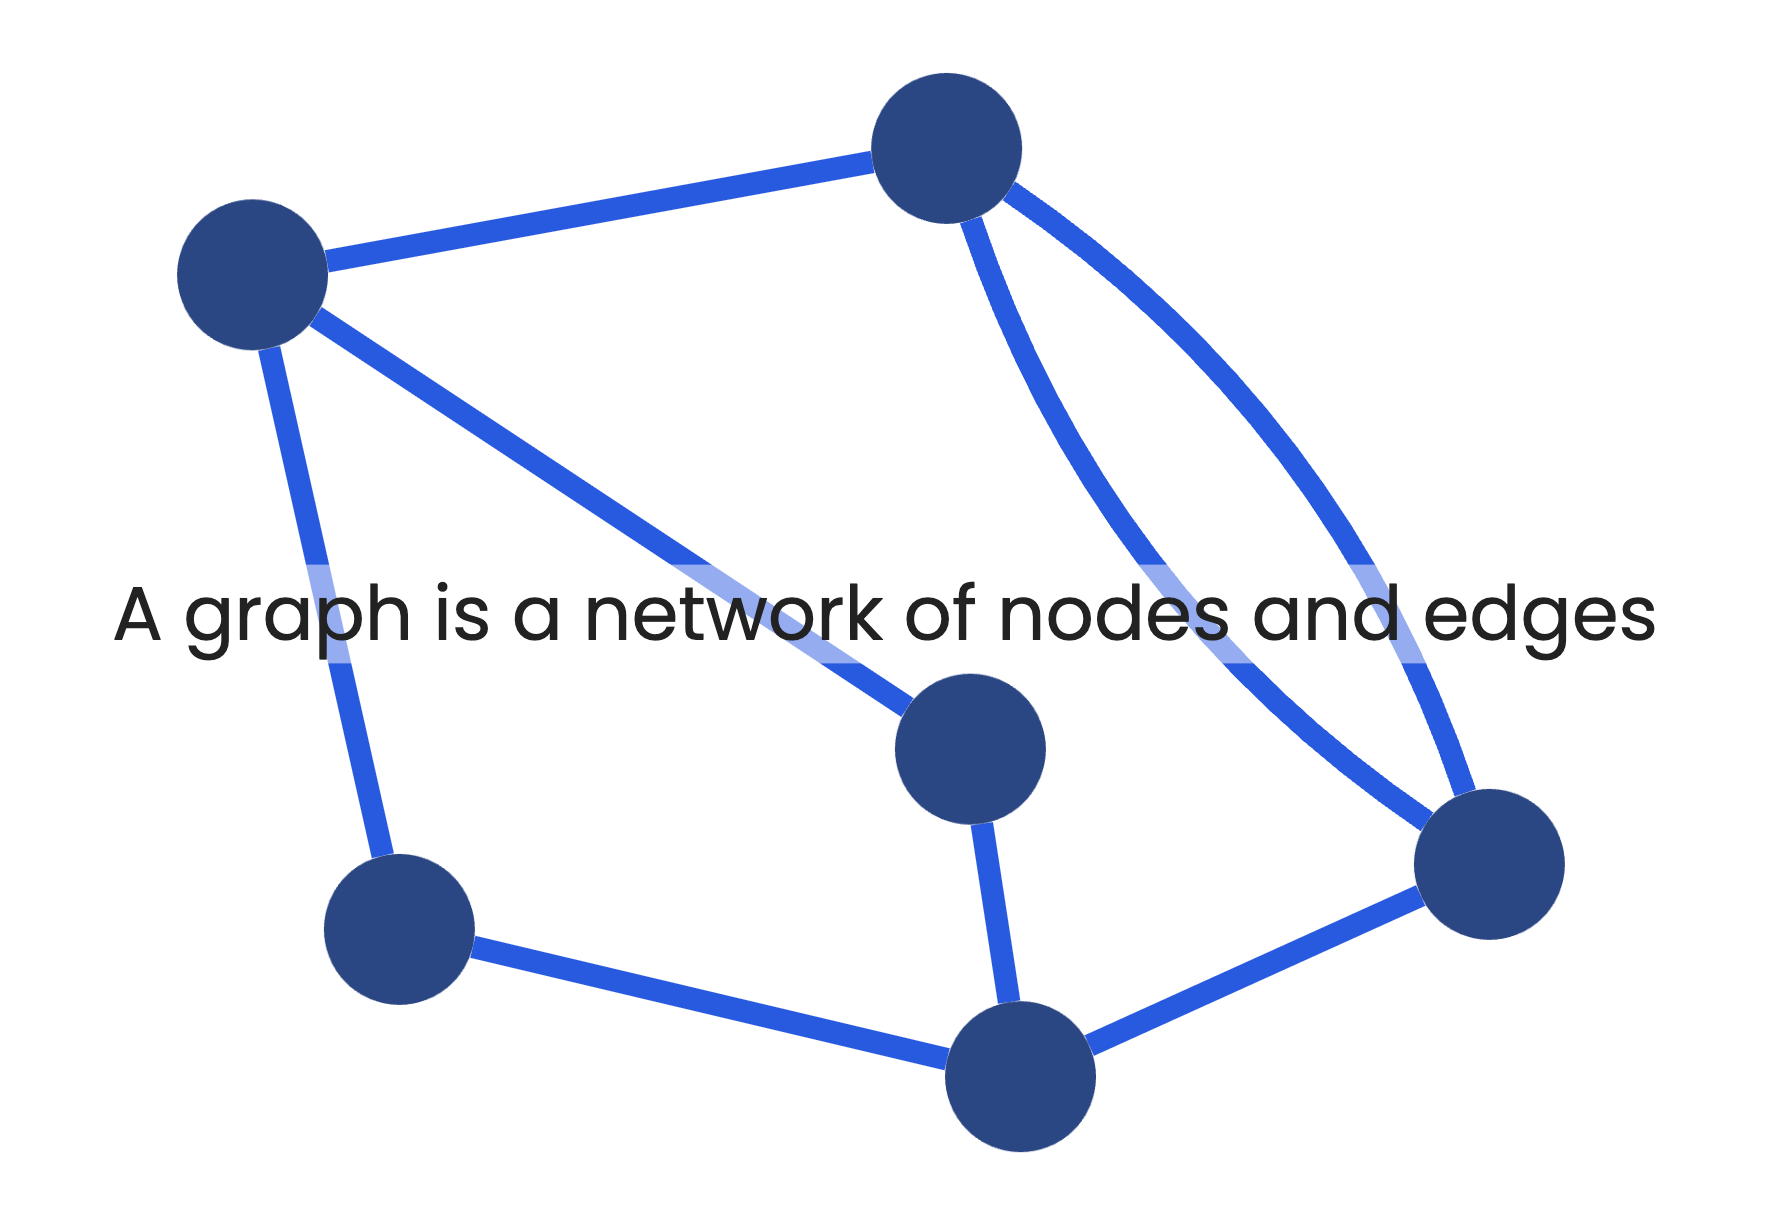
In a knowledge graph, the edges are directed
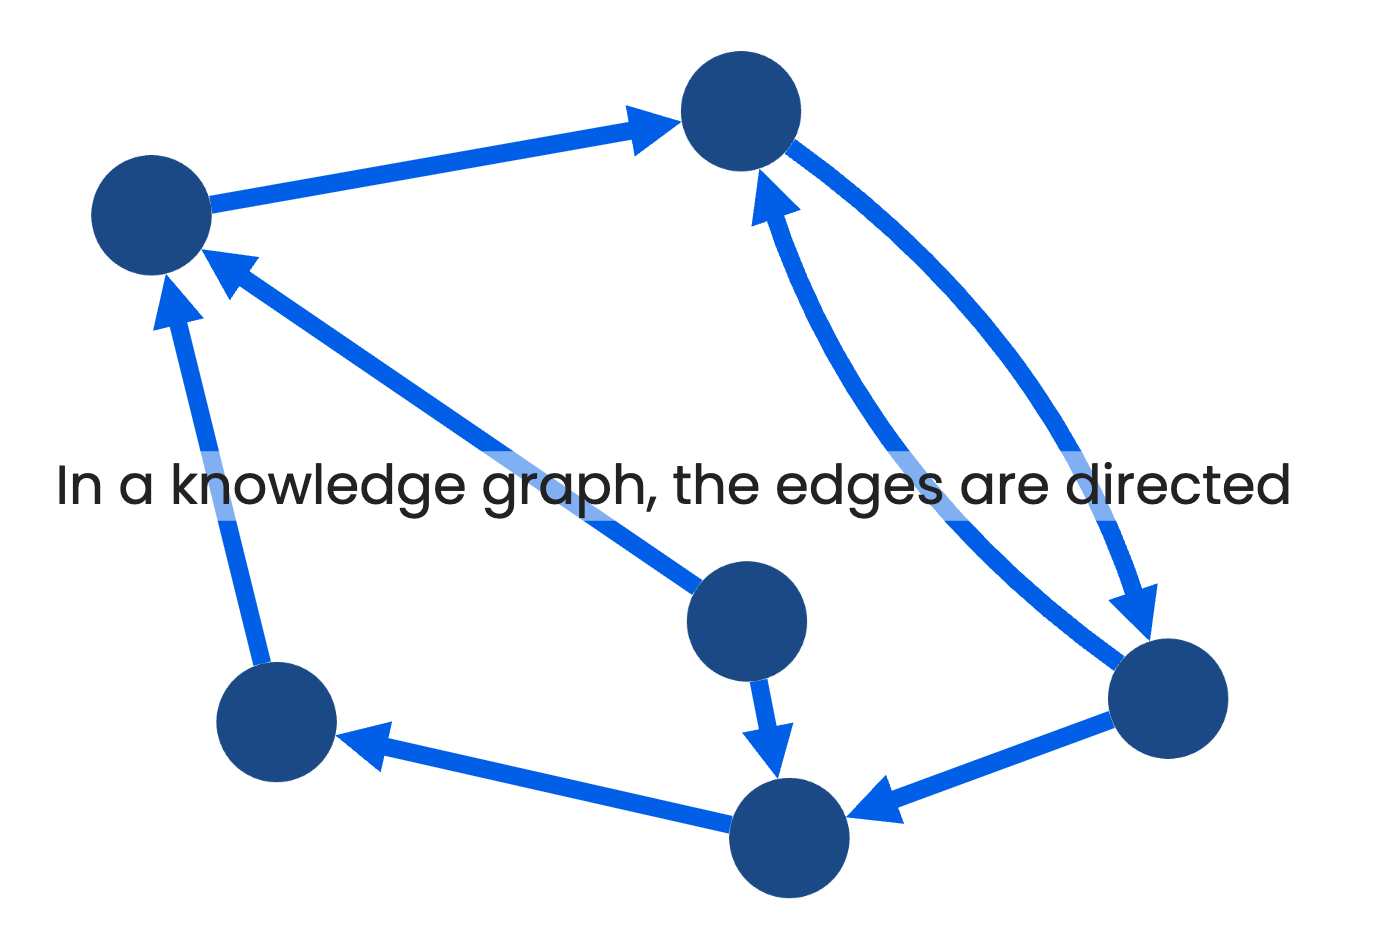
Why this beats a spreadsheet
A table forces every "thing" into one row of one sheet, with the columns somebody decided on in advance.
A graph lets a thing have as many connections as reality actually gives it — and lets it be found from every direction at once.
The book can finally sit on more than one shelf.
Not another application
- A knowledge graph is an integration layer, not a new system to migrate into
- It sits on top of the CMMS, the DMS, the BIM tools, the ERP — none of them have to change
- Nothing gets thrown out, and nobody has to be convinced to stop using their favourite tool
Exercise: "Graph your Monday"
No computers.
In pairs, 15 minutes.
- Pick one real, recurring task from your own job.
- Draw it as a network: every system, document or person involved becomes a node.
- Every time information has to move between two of them — a phone call, a copy-paste, an e-mail — draw an edge.
Now count your edges
How many of them are manual — a human doing connecting that a computer could do instead?
?
That's your silo score.
Key takeaway
"My organization's information already behaves like a graph — I've just been forcing it through filing cabinets instead of letting it connect."
Tomorrow
We take one of those edges apart and ask what it takes to state a fact so precisely that a machine — or an AI — can act on it without a human translator in the loop.
Day 2 — Triples, TBox & ABox